Over €1 trillion 'tied up in net working capital'
Europe’s top 1000 nonfinancial companies lost the use of over 1 trillion euros last year, which stayed tied up in net working capital, according to the latest figures
Europe’s top 1000 nonfinancial companies lost the use of over 1 trillion euros last year, which stayed tied up in net working capital, according to the latest figures
The latest figures from the Europe Working Capital Survey reveal that Europe’s top 1000 nonfinancial companies cash conversion cycle (CCC) slipped 3.6% last year, as net working capital expanded. Bastian Krawinkel, Senior Manager at REL Consultancy, part of the Hackett Group Company, explains the figures.
Most of the economic indicators out of Europe have been good lately, and economists are generally optimistic that 2017 will be a good year for the world’s biggest market. One important exception has been working capital. The cash conversion cycle (CCC) slipped 3.6% in 2016 among the REL 1000, Europe’s top 1000 nonfinancial companies, as net working capital expanded. Collectively, this meant that for another year, Europe’s 1000 largest public companies lost the use of over 1 trillion euros, which stayed tied up in net working capital.
The deterioration in cash conversion was mainly due to increases in inventory and receivables. Overall, DIO (days inventory outstanding) grew by 9.1%, DSO (days sales outstanding) increased by 5.9% and DPO (days payable outstanding), the third component of working capital, climbed 10.1%, its best performance since 2007. This strong performance somewhat offset the disappointments of the other results.
Why the discrepancy between the largely good macroeconomic news and disappointing working capital figures? Optimism may be one culprit. Inventories build up when sales slow, but they also build sometimes in expectation of a coming uptick in sales.
Overall pressure to adjust payment terms means an extension to DSO for many, but on the supplier side an increase in DPO, which may be due to the growing use of supply chain finance, makes it possible to extend payment dates with limited impact on the vendor’s actual date of payment.
Additionally, the improvement of DPO and the decline of DSO may be due to the further implementation of the European Union late payment directive. National governments have implemented the directive over the past few years, which mandates that companies pay their suppliers within 60 days. With this implementation, lawmakers had intended to change the habits of companies that habitually paid late – in some southern European countries, such as Italy or Spain, for example, the standard payment term often extended to 90 or 120 days. However, it appears to be encouraging firms in countries with shorter payment terms, such as Germany, the Nordics and Switzerland (where companies have traditionally operated on a 30-45 days cycle), to extend their terms to 60 days. As a result, a regulation intended to shorten payment terms actually hurt DSO.
Finally, companies may be optimistic today because although their revenues fell by 1.2%, their cost of goods sold (COGS) fell nearly three times as fast (3.1%), lifting the average gross margin by 5.4% and EBIT margin by 10%. The euro volatility will have played a part in the trend for these year-on-year changes, as many companies report in their local currencies and these are converted to euro for the purposes of the survey.
Despite the short-term decline, however, companies have some justification for their continued optimism. Over the past five years and despite the disappointing 2016 results, average revenue is still up 6.6%, and cash conversion efficiency (the ratio of operating cash flow to revenue) has grown by 9.6% since 2011.
Relatively few companies have been able to sustain their working capital improvements for long. Only 11% (114 companies) improved their CCC performance for three years running, 4% (38 companies) sustained it for five years, and 1% (10 companies), over seven years.
The Terrific Ten’s performance suggests that working capital excellence is a goal worth striving toward. Since 2009, this group saw their revenue rise by 47%, compared to an average of 34.9%; their cash on hand grew by 230.5%, compared to 92.3%; and their cash conversion compressed by 263.3% compared to 9.2%.
For 2016, companies in the first quartile of working capital performance also topped the median substantially. Days sales outstanding were 38% lower for the first quartile, 33.2 days compared to 53.3 in the median; days inventory on hand was 67% lower in the first quartile, 20.7 days compared to 62.3 days; days payable were 53% longer, 90.9 days versus 59.6 days for the median. The upshot: Cash conversion in the first quartile was only 8.5 days compared to 48.5 for the median.
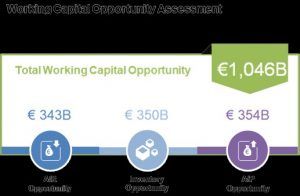
As the performance of these champions indicates, much more could be done to reduce the €1 trillion mountain of cash currently tied up in excess working capital – 7.1% of FY 2016 GDP of €14.82 trillion. Of that, the receivables opportunity represented a €343 billion lost opportunity; inventory, another €350 billion; and payables, €354 billion, as shown below.
Low interest rates are a big reason companies have not made working capital optimization a priority. REL’s EU 1000 added €197 billion in debt over the course of 2016, increasing the total debt level by 5.9% year on year and bringing the total growth in debt to 33.6% over the past five years.
All that cash has had a distorting effect on company books, raising cash on hand by 144% between 2008 and 2016, plumping overall indebtedness by 50%, and increasing the corporate cash hoard from 5.6% in 2008 as a percentage of revenue, versus 11.5% in 2016 – 106% higher than its 2008 level. As cash has risen, imagination seems to have declined. Dividends are up 21% since 2008, while CAPEX has grown a mere 6%.
At the industry level, the top 10 industries for working capital performance saw their CCC shrink by 23%, their DSO by 2%, and their DIO by 8%. On the other hand, the bottom 10 saw their CCC rise 29%, their DSO by 7%, and their DIO by 4%. Overall, the top 10 could point to a rise in revenue of 1% as the bottom tenth brought home a disappointing negative 4%.
There is a switch in the top-performing industries year on year. Semiconductors and equipment’s CCC improved 23% (to 118 days from 154 days in 2015), energy services & equipment by 20% (to 68 days from 84 days) and beverages by 52% (to 14 days from 29 days).
At the other extreme, CCC performance slipped for oil and gas (down 41%, to 25 days from 17 days), commercial and professional services by 15% (to 32 from 28 days) and internet retail, which saw its impressive negative 16-day CCC dwindle to 2 days.
On a country-by-country basis, Belgium led the CCC trend chart in 2016, with negative 16 days of cash conversion. Belgium’s improvement was particularly strong, dropping 75% in 2016, and bringing its total fall over the past five years from 16 days to negative 16 days’ CCC.
Other top markets include Spain, with 7 days’ CCC, thanks in part to having the lowest DIO numbers in the European Union while maintaining a high DPO, and Portugal, whose 14 days of CCC is based on its low 34-day DSO score.
At the other extreme, Greece’s CCC slipped by 70% in 2016, to 36 days, while Norway and Cyprus watched their CCC tumble 31%, to 68 days and 79 days, respectively.
The Big Sure Thing
Even more than most years, the business outlook for 2018 is deeply uncertain. Right now, most polls show that executives are optimistic, but Brexit, Russian-American political tensions and interest rates are all out of their hands. One of the few strategies almost certain to reduce risk and improve profitability next year, under any eventuality, is to optimize working capital.
Although a number of companies have already tried to harvest a little of Europe’s 1-trillion-euro working capital opportunity through such measures as extending supplier payment terms, surprisingly few have taken full advantage of the broader range of working capital management opportunities available. These include both traditional (such as instilling a cash-focused culture, billing and collection optimisation, inventory management) and cutting-edge (such as big data analytics and process robotics).
The REL Working Capital Survey and scorecard calculates working capital based on the latest publicly available annual financial statements of the 1000 largest nonfinancial companies in Europe, according to statistics gathered by FactSet..
Bastian Krawinkel is a senior manager at REL Consultancy, part of the Hackett Group Company.